
New features 2024 Series - Electrical grid calculation
Electro Graphics releases the latest 2024 Series of electrical and photovoltaic design software. Here are the most important features and enhancements introduced about Electrical grid calculation in the software Ampère line and EGlink.


See all new features 2024:
Download brochure Electro Graphics New features 2024
Quick editing of data for one or more units
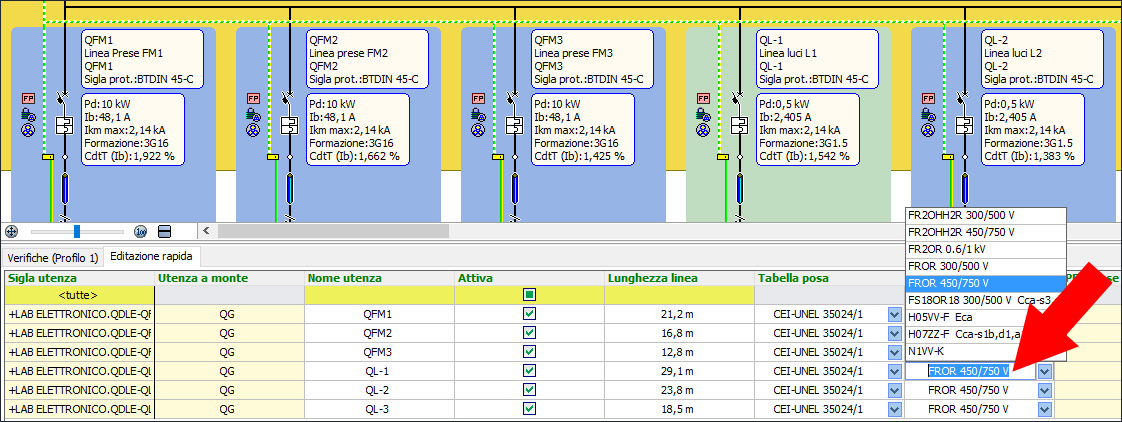
The Quick Editing panel is a powerful tool that allows you to quickly and easily edit the data for one or more consumers.
It is available in all versions of Ampère, but its features are more complete in the Professional and Evolution versions.
The Quick Editing panel is composed of a table and a series of editing fields. The table displays the selected consumers, arranged in a mesh. The columns of the table show the data of interest, depending on the chosen display profile. The editing fields allow you to modify the data of one or more consumers at the same time.
The Quick Editing panel is an ideal tool for making quick and precise changes to consumer data. It is particularly useful for operating on similar consumers, for example to change the data of a group of generators or a series of lines.

Here are some examples of how to use the Quick Editing panel:
• To change the name or value of a consumer, simply type the new name or value in the editing field.
• To change the data of multiple consumers at the same time, simply select the consumers and then change the data in the editing fields.
The Quick Editing panel is a powerful and versatile tool that can significantly simplify the management of consumer data.
Revision and improvements in project configurations with direct identification and editing of consumers
The advanced configuration functionality has been revised and implemented to ensure simpler and more dynamic use, and to allow direct comparison between different operating scenarios that an electrical system can assume.
An electrical system is often a dynamic entity, with its rhythms and cycles. Protections and conductors must cope with functional or seasonal load variations. An effective tool such as configuration management allows the analysis of the network in different operating modes. The designer, defining the same network in different load regimes, has the possibility to control the critical elements under all possible combinations.
Ampère, therefore, allows you to create different configurations or variants of the same project, each different from the other due to the effect of some consumers that can operate according to different parameters.
Each state can be saved with an identifying name and recalled as needed to recalculate and compare the behavior of the network between the various configurations.
An example for everyone is the study of the network in normal or emergency operation, or the study of the network with seasonal loads, alternating active loads.
The Configuration tab shows the list of configurations created for the project and a grid for setting the configuration properties of the selected consumers.
The list of project configurations allows you to quickly select and switch from one configuration to another, simply by clicking on the name of the configuration you are looking for. It is also possible to access the emergency operation of the plant by clicking on the gray button next to the name. When studying the new working state, the button changes color to red.
The variables in play at the consumer level are:
• Active/inactive state of a consumer, in practice whether the power point is inserted or removed.
• Electrical system, useful for example for consumers that change system when switching from normal to emergency state.
• Downstream system, as above, only referring to the downstream system present in transformers and UPS.
• Contemporary coefficient (distribution consumers) or utilization (terminal consumers).
• Network switch, allows you to choose the power source.
• Regulated energy production: useful for generator type consumers, allows you to define the working parameters of the generator.
• Load profile: defines the trend of the coefficient over 24 hours, activating the Load profiles manager.
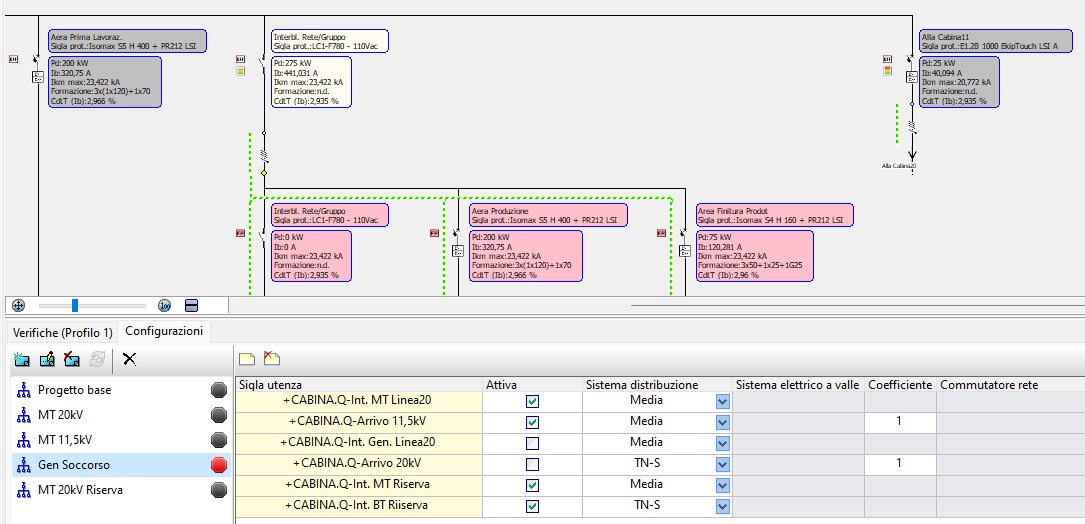
Note. Load profiles are only used during the analysis phase, when the network is studied over time. So if you do not intend to perform any network analysis, you do not need to worry about inserting load profiles. Adding units to configurations allows you to define and specify the elements that distinguish one configuration from another. It is therefore sufficient to add a few units to the configurations to determine and analyze different operating states of the project.
Calculation of the electrical network with configurations
If an electrical system has multiple project configurations, you can run the Calculate all command and extend it to all available configurations or to all those of interest, to recalculate and update the plant data for the selected scenarios. In this way, it is simple and fast to move from one configuration to another, thus allowing you to check that the plant is adequately sized and coordinated; it is also easy to analyze whether or not there are any checks that do not respond correctly and that therefore show the need for adjustment.
It is also possible to enable calculation on multiple configurations with the Apply Calculate all to each configuration option and then select which configurations to recalculate or not by clicking on the check boxes of interest.
Configuration management with real-time network recalculation
Configuration management is a key feature of the Ampère electrical network simulation software. It allows users to create different operating scenarios for the network and to study the impact of various changes on the performance of the network.
Once a new configuration has been created, you can simulate different operating states of the network by activating or deactivating parts of the plant, imposing utilization or contemporaneity coefficients, and establishing different operating points for generators or storage devices. This allows users to study the correct sizing of the plant and the goodness of the protections and settings chosen for all possible operating states of the network.
For example, if there are generators in the network, you can simulate different operating conditions for each one by setting a different power factor in regulation or specifying whether the generator is in absorption or induction. This allows you to outline a new flow of power to the delivery point.
After specifying a operating point for each generator present in the project configurations, the "Calculate all" function allows users to update the plant to the new operating state. You can appreciate in the "Supply" window the power contribution provided by the plant in the condition identified by the configuration "Scenario 1".
Similarly, by selecting the "Scenario 2" configuration, you can specify new operating parameters for the generators in question and observe how this is reflected in the characteristic quantities of the network, such as the available power in Supply.
The configuration management functionality is a powerful tool that allows users to study in detail the behavior of the electrical network in different operating states. This functionality is essential for network operators who must ensure the safety and reliability of the electrical network.
Configuration printing
The Print interface displays the list of active configurations in the current project. You can select the configurations to be included in the prints that contain the configuration identifier label.
In the presence of active configurations, the prints generated from the model (.xls) must show the information of the labels of the selected configuration, and must also allow the comparison of the data of the different configurations. The two printing modes are defined as follows:
• One selected configuration: The prints show the data of the consumers as defined in the scenario configuration.
• Two or more selected configurations: The prints prepared for the comparison of configuration data, have columns of information that are replicated for each selected configuration.
Correlation between project documentation and selected configuration, to evaluate electrical parameters in different operating conditions
The study of an electrical installation in different operating configurations must be documented. Project prints follow configuration management, allowing you to create parts of the technical file based on the selected configurations.
In addition, if technical choices must be justified, or electrical properties compared, new comparative printouts are a powerful working tool to explain in detail the verifications and results obtained.
Extension to the calculation of faults in IT systems according to CEI 64-8 par. 413.1.5.4
IT systems are low-voltage systems in which the star point of the transformer is open or is connected to ground through a high impedance. This means that the values of first ground fault currents are normally low. The fault current still depends on the capacitance of the lines below the transformer, with average values set at 300 pF/m. Although normally small, this contribution is considered by the software in the calculation of the first ground fault.
For IT systems, the calculation of the second ground fault can be performed according to the procedure indicated by the CEI 64-8 standard. The option is located in the Calculation Setup tab of the Properties dialog box.
The method for calculating the second ground fault in IT systems consists of applying the method of the CEI 64-8 standard, calculating Zs (phase-protection ring impedance) and Z's (neutral-protection ring impedance), and choosing the worst situations for the intervention of the protection. Otherwise, the software has an iterative calculation that simulates all the possibilities of a second fault, which can occur at a random point in the network. Choosing the "2 Ia Zs" method can be useful for complex grid with long calculation times.
New details in the verification of indirect contacts, due to the effect of transformers
Ampère now applies the ability to analyze the flow of fault currents along the line to improve the verification of indirect contacts in particular situations. Following a ground fault, the protections must operate to open a ground fault current Ik1 phase. Differential or magnetic protections are normally responsible for this task. The phase-ground fault regime is valid in the electrical area downstream of the transformer. At primary, the currents that feed the fault only involve the phases with values in modulus dependent on the transformer's turn ratio.
Therefore, a protection located upstream of the transformer must operate for the 'seen' current, transformation of the phase-ground current that flows at the fault point. What has just been explained is now performed by the software, expanding the verification capabilities to more complex situations.
Completion of the DC calculation model, according to IEC 61660-1, with the calculation of minimum currents and sigma coefficients, applied to maximum and minimum fault currents, to take into account the effective contribution of each source
Sigma correction factor
The IEC 61660-1 standard introduces a sigma correction factor to be applied, for each source that feeds the fault, to the peak and quasi-stationary short-circuit current. This factor takes into account the fact that not all the current generated by a source passes through the short circuit. In fact, part of the current is closed by means of the impedances of the other sources.
The Ampère Professional and Evolution software applies an algorithm that propagates the current with which each source contributes to the fault, "reading" the share that reaches the fault point. This method expands the example and considerations proposed by the IEC 61660-1 standard, as no limits or constraints are imposed on the structure of the DC electrical networks managed by the software. The values calculated for σj are normally slightly less than unity.
Minimum fault currents
In parallel to the maximum fault currents, the minimum currents are calculated by applying the correctives at the points indicated by the standard, namely for rectifiers and batteries. For electrical lines, the maximum operating temperature, that is at overload, is applied.
Saving projects in EG Cloud and sharing documentation
EG Cloud is a cloud data backup and sharing service, managed through the software infrastructure and data center of Acronis, that Electro Graphics makes available to users of software under warranty and/or maintenance contract.
With EG Cloud, you can:
• Upload projects to your cloud space, organized in folders and subfolders.
• Download and open projects previously uploaded to EG Cloud.
• Browse your cloud space through the EG Cloud browser, which provides the essential commands for creating new folders, uploading and downloading files, creating sharing links, etc.
• Access your cloud space through the Acronis web portal to access content and account settings pages.
• Access your cloud space from mobile devices through the Acronis Cyber Files app, which allows, among other features, to add annotations to PDF prints for subsequent import into electrical schematic drawings in graphic environment.
• After confirmation of activation of an EG Cloud account, in Solergo the functions of opening and saving in EG Cloud can be started from the toolbar.
EG Cloud cloud saving and sharing service New feature 2024
Integration of summaries, by zone and panel, in the bookmarks of the attachments and the technical file generated in PDF
The new version of Ampère offers a series of new printing features that allow you to create more complete and informative documents.
Here are the main news.
Bookmarks in PDF prints
The Save PDF command now adds bookmarks to the PDF file divided by Zone and Panel. The bookmarks point to the page of the first utility that corresponds to the zone/panel. The Data panel print only reports bookmarks for new projects.
Save PDF in PDF/A format
PDF/A is an international standard (ISO19005) that allows you to create PDF files that can be archived for a long period of time without losing their characteristics. To produce a PDF/A with Electro Graphics products, you need to activate the Save in PDF/A format option in the Page setup window, Layout page.
Merging of PDF prints
The Concatenate pdf command has been replaced by the Merge pdf command. The generated PDF file contains bookmarks composed of the titles of the PDF prints and any bookmarks of the added PDF files.
List of chapters of the calculation report print
The Calculation report options command shows the list of chapters to include in the report. This list corresponds to the chapters present in the selected model.
Printing of Utility diagram and Printing of attachments from meshing
The Print utility diagram and Print attachments commands are now available in the context menu in meshing data panel.
Utility diagram management
When the Utility diagram management window is opened, on the Panels page, the list of panels is grouped by zones. Sorting and search commands are present. The panel selected in meshing is selected.
Printing of attachments
For printing attachments, the selection filter for utilities is preset on the panel selected in meshing.
These new features make Ampère an even more powerful and versatile tool for creating electrical network documents.
Revised graphics interface with handling of text height and font set in Windows, particularly useful with HiDPI and 4K monitors
Windows allows you to change the size of text, images, and interfaces displayed in Windows and in installed applications.
With the 2024 version, the graphical interface of all Electro Graphics software, including the Ampère software line, has been completely updated to manage the height and font of text set in Windows. Now the windows are automatically resized proportionally to the general Text size parameter set in Windows.
The automatic resizing of windows according to the text size brings the following advantages to graphical interfaces.
• Better readability: Larger texts are easier to read, especially for people with vision problems.
• Greater accessibility: The automatic resizing of windows makes Solergo more accessible to a wide range of users, including those with vision problems, motor disabilities, or learning difficulties.
• Better user experience: The automatic resizing of windows makes Solergo more enjoyable to use, as it allows users to adapt the text size to their needs.
Device archive extension and update
For all types of devices that can be used in a photovoltaic system, new series have been integrated into the archive.
New Ampère Evolution: software for calculating extended electrical grid with distributed generation, focused on FER grid with photovoltaic and wind generation
Ampère Evolution is the new fourth level of the Ampère line of electrical network calculation software from Electro Graphics. It is a comprehensive and powerful software that allows you to study plants powered by large-scale renewable energy sources.
Ampère Evolution has a number of advanced features that make it a unique software of its kind. Among these features, we find:
- the ability to study the effect of longitudinal and transverse network elements in the calculation of Load Flow and Capability Curves;
- the availability of network models for wind generators and automatic reactive power compensation systems;
- the ability to create a photovoltaic plant model by choosing the panels, inverters and connecting cables;
- the ability to calculate the real Capability Curve taking into account network effects, according to Terna's indications;
- configuration management.
Thanks to these functions, Ampère Evolution is the ideal software for studying large-scale renewable energy plants. It is a comprehensive and powerful software that allows you to obtain accurate and reliable results.
In addition, Ampère Evolution is constantly updated to follow and manage the technical evolution of electrical networks powered by renewable energy sources, medium and high voltage storage systems, electric vehicle charging stations EV, taking into account the technical connection specifications defined by national technical committees and supply companies.
Here are some examples of how Ampère Evolution can be used to study large-scale renewable energy plants.
• To study the impact of a photovoltaic plant on an electrical network.
• To study the impact of a wind farm on an electrical network.
• To study the impact of a storage system on an electrical network.
• To study the impact of an electric vehicle charging station on an electrical network.
Ampère Evolution is a powerful tool that can be used to improve the design and study of electrical networks powered by renewable energy sources.
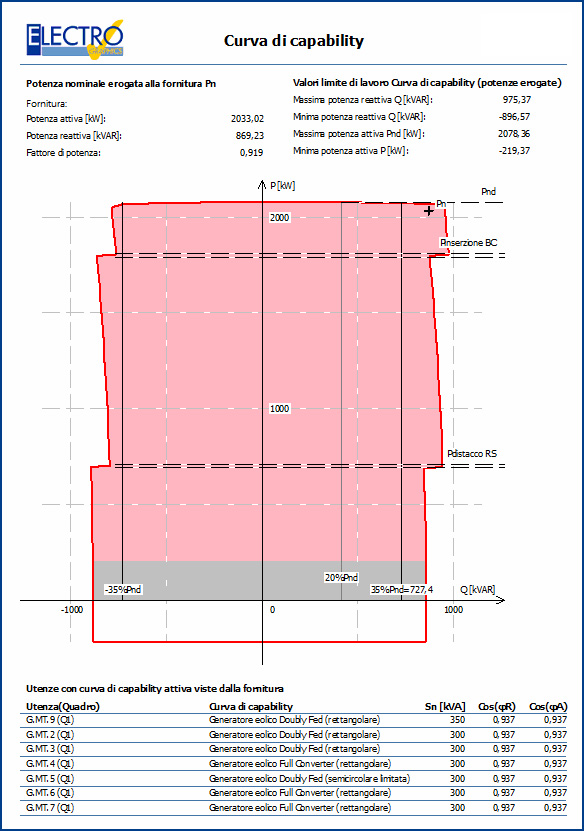
Capability curve
The capability curve is a document required for connection to the distribution grid and normally required by the supply company. The Ampère software allows you to trace the capability curve, simulating all the operating points of the generators and calculating the main electrical quantities of the plant at the connection point.
The registration of the possible operating points and the corresponding reactive power deliverable, defines the capability curve of the plant. This curve takes into account the internal network, under the responsibility of the producer, built up to the delivery point, including all the equipment that constitutes it. If there are loads, it will be up to the designer to exclude them or not before making the calculation.
Representation Base or Advanced
The base representation of the capability curve is calculated at the connection point based on the curves of each generator and the influence of the loads only present in the network. The base representation is available for the Standard, Professional and Evolution versions of the Ampère software.
The Advanced representation of the curve, available in Ampère Evolution, takes into account the influence of the longitudinal and transverse parameters of the distribution grid: resistances, inductances and capacitances. Losses at the load of transformers are also included in the advanced computation.
In addition, if present in the grid, capacitive and inductive units used for automatic reactive power compensation, defined as Capacitor bank and Shunt reactors, will be considered.
Calculation of the capability curve (advanced, for Ampère Evolution)
After assigning the capability curves for each generator or inverter present in the plant, before performing the calculation of the Capability curve at the delivery point, it is necessary to verify that the advanced calculation has been activated in the Software Properties window. The function can be activated in the Properties dialog box, selecting the Consider longitudinal elements for Load Flow calculation option.
The notes in the window provide a lot of information about the effects of the activated option.
To ignore the active and reactive powers dissipated in the lines and not taking into account the capacitive currents is a calculation hypothesis widely applied in the dimensioning of low and medium voltage distribution lines. As in all studies of physical models, each approximation has its field of validity, beyond which the error made is no longer negligible. Similarly, large-scale wind and photovoltaic plants, need a greater detail to describe the active and reactive powers involved and transmitted to the network.
The software presents the average operating capacity values for overhead lines, in medium and low voltage.
The designer can intervene at a global level and also on a single utility, for example if the cable manufacturer provides the exact operating capacity. To do this, simply open the Line data tab in the Utility data window and enter the Operating capacity value expressed in pF/m.
After setting the capability curves and activating the advanced calculation, it is time to start the study of the Capability curve at the delivery point. Open the Supply window and access the Capability curve tab.
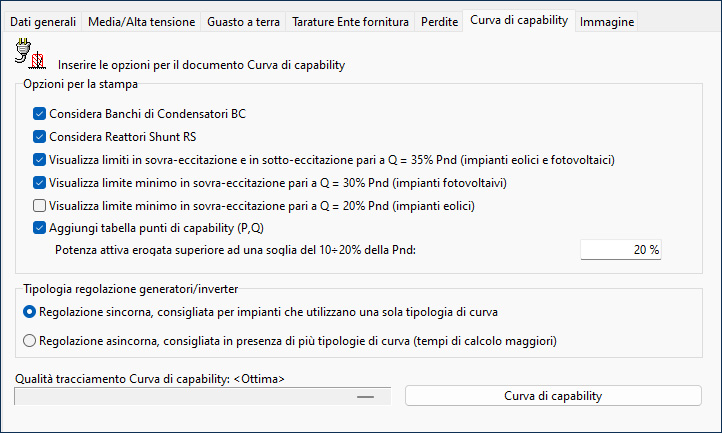
The designer has several options to customize the document that includes the Capability curve, the list of generators involved, and the sampling of the values of active power (P) and reactive power (Q) of the curve.
The study adopts the style and reference lines of the A.17 Wind Farms and A.68 Photovoltaic Plants annexes by Terna.
The Print options panel allows you to customize the appearance of the Capability curve document. You can choose to display or not the capacitor banks (BC) and shunt reactors (RS), to display the minimum and maximum limits of reactive power at various percentages of active power, and to add a table of capability points.
Synchronous regulation is preferable when all the generators in the plant have the same capability curve. The software simulates that all the generators are regulated with the same operating angle, covering a full angle covering the 4 quadrants of the power plane.
Asynchronous regulation is preferable when the generators in the plant have different capability curves. The software regulates the generators independently of each other, trying to cover the largest possible working area.
The curve tracking quality can be adjusted to improve the accuracy of the Capability curve document. It is advisable to start with a low quality in the initial testing phase, and then increase until you get a satisfactory result for printing.
The Capability curve command starts the study, which ends with the list of print commands. The Capability curve document reports the list of generators involved in the study, with the nominal power values and those of the power factor limits in delivery/capacitive and in absorption/inductive. The list of reactive compensation elements involved in the simulation follows, that is, those regulated to intervene within the range of total active power provided by the generators. The data reported are the insertion power, the hysteresis power, and the reactive power inserted or disconnected.
If activated among the options, the document closes with a list of Capability curve points, reporting the curve discretized in P,Q points, active and reactive power positive and negative. These data can be used for further simulations or personalized reports. The number of points depends on the Tracking quality selected in the Properties window.
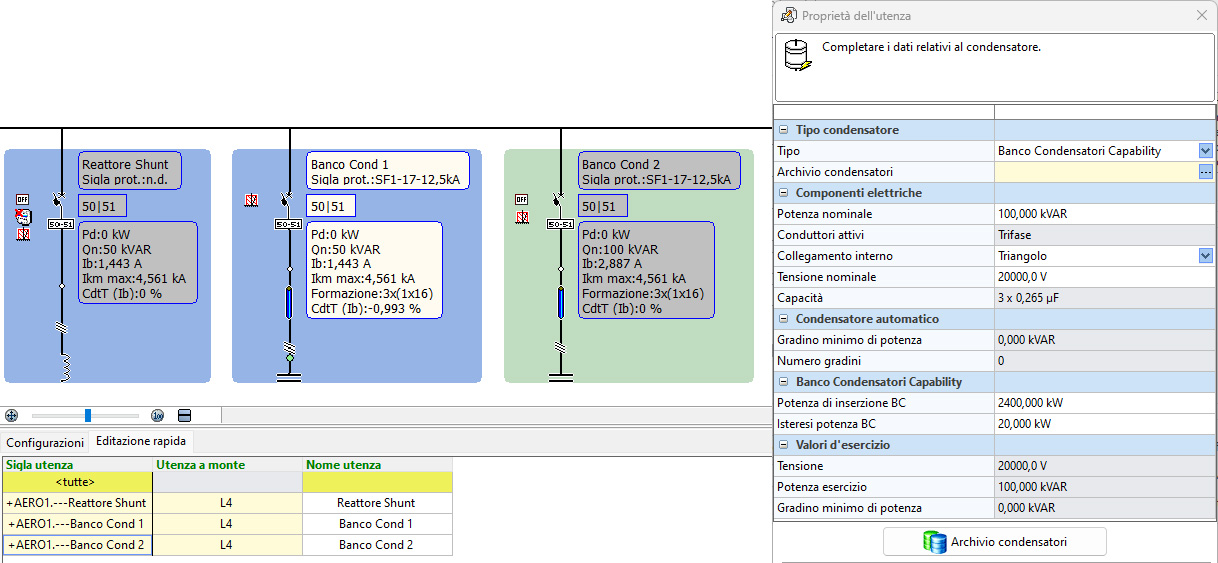
Capacitor Banks and Shunt Reactors
Capacitor banks and shunt reactors are used in wind and photovoltaic plants to compensate for the excess of capacitive power at low load or to provide capacitive power at high load, when the lines absorb inductive power due to the high currents involved.
The Ampère Evolution software provides the ability to define utilities of type Capacitor Bank and utilities of type Shunt Reactor with a fixed value of insertion or disconnection with respect to the active power measured at the connection point.
Utilities of type Capacitor Bank are managed by the Ampère Evolution software as a variant of capacitive utilities. In particular, to comply with the provisions of the annexes described above, they have an Active power insertion, which commands the closing of the bank protection when it exceeds this threshold and the disconnection if the active power absorbed at the supply level returns to a lower value.
The Ampère Evolution software is a powerful tool that can be used to improve the efficiency and safety of wind and photovoltaic plants.
Shunt reactors
Shunt reactors are used in wind and photovoltaic plants to compensate for the excess of inductive power at low load or to provide inductive power at high load, when the lines absorb capacitive power due to the high currents involved.
The Ampère Evolution software provides the ability to define utilities of type Shunt Reactor with a fixed value of insertion or disconnection with respect to the active power measured at the connection point.
Utilities of type Shunt Reactor are managed by the Ampère Evolution software as a variant of inductive utilities. In particular, to comply with the provisions of the annexes described above, they have a Power disconnection, which commands the opening of the reactor protection when it exceeds this threshold and the insertion if the active power absorbed at the supply level returns to a lower value.
In addition, these inductors cannot have a step-by-step regulation, therefore they are a single shunt reactor with fixed reactive power. If desired, the designer can create multiple similar utilities with different reactive power and insertion powers, but independent of each other.
To create a shunt reactor, it is necessary to open or create a utility of type Shunt Reactor. Then, it is necessary to call the Utility Properties dialog box through the [...] command next to the Inductance. Finally, it is necessary to select Shunt Reactor Capability in the Type drop-down list.
In the electrical components, it is necessary to define the size of the reactor, and in parallel how many Henry are needed at the nominal working voltage.
Then, it is necessary to set the Power disconnection RS, a value that is compared to the active power supplied by the supply. The software simulates the presence of a power meter located at the delivery point (the supply to which the shunt reactor is electrically connected), the logic of which activates or deactivates the utility.
It is possible to enter a value of zero to disable the shunt reactor. This is the only way to 'freeze' the utility and completely disable it.
Among the data there is also the Power hysteresis RS, the effect of which is only graphical in the representation of the Capability curve.

Shunt reactor utilities are highlighted in the meshing by the Capability curve symbol, which helps to identify their particular functionality. These utilities can only be activated or deactivated by the software, the designer must set a threshold of zero to never connect the reactors to the network.
In addition, it is important to remember that the working mode that considers network elements must be activated, which is essential to activate all the advanced features dedicated to the study of wind and photovoltaic plants provided by Ampère Evolution.
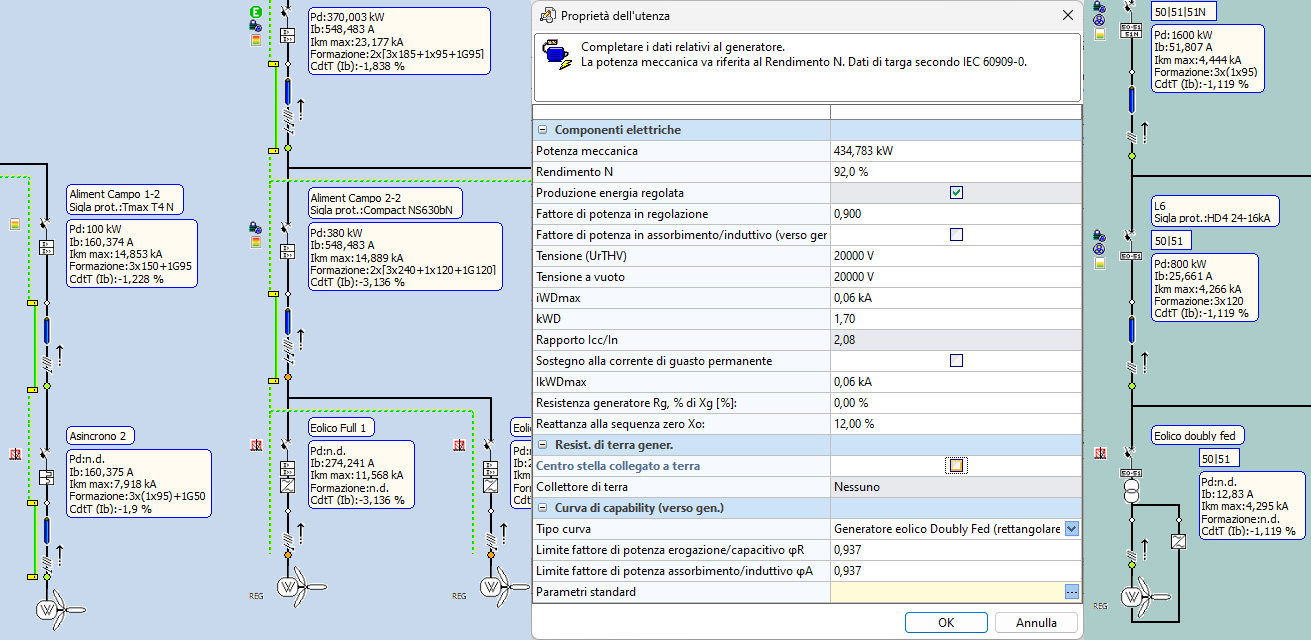
Wind generators [IECEN 60909-0]
Ampère Evolution allows you to create three types of wind generators with electrical models in line with the definitions provided in the CEI EN 60909 standard.
• Asynchronous wind generator
• Doubly fed wind generator
• Full-size converter wind generator
The software models allow you to calculate the short-circuit currents for asynchronous generators, asynchronous generators with doubly fed power, and finally full-size converter generators.
For doubly fed generators, the current values refer to the terminals upstream of the transformer, as the generator and transformer are considered as a single unit. Similarly, for the full-size converter generator, the values are to be understood upstream of the converter.
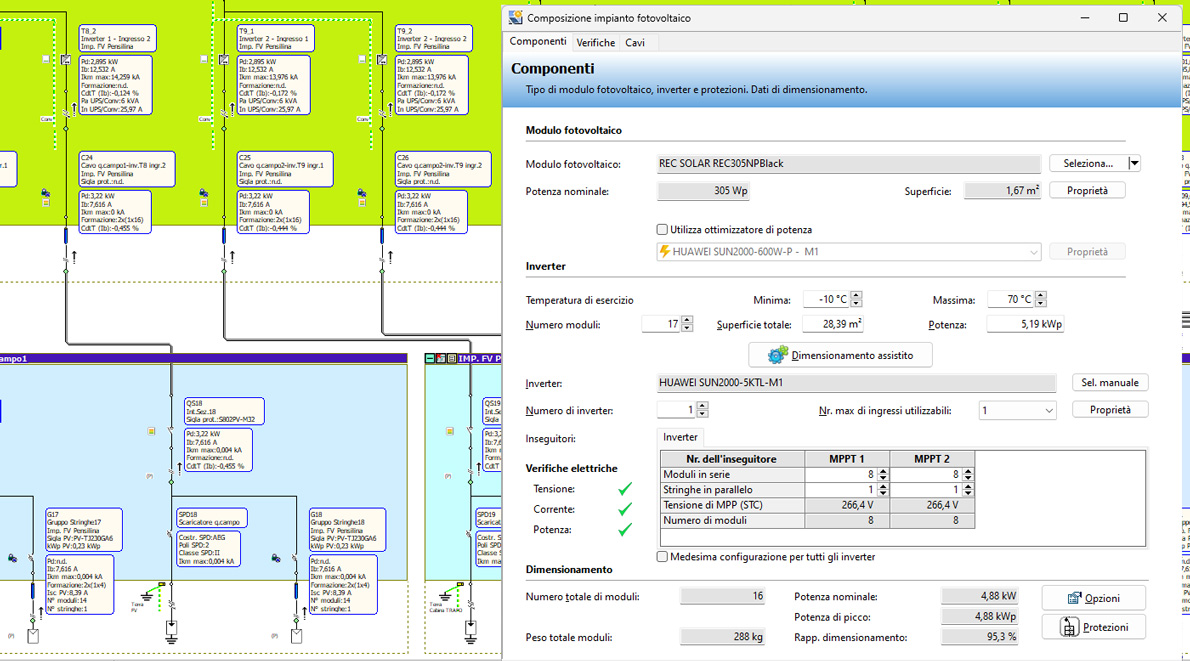
Photovoltaic plant composition
Ampère Evolution can be used to create a photovoltaic plant by defining the field of panels, the inverters, and the connecting cables. The creation process is composed of three phases:
• Components: In this phase, you need to select the type of photovoltaic module and the inverter. You can also enter the dimensions of the plant and the nominal power.
• Verifications: This phase checks the consistency of the plant configuration. If errors are detected, you need to correct them before proceeding to the next phase.
• Cables: In this phase, you need to select the cables and the connection routes. You can also enter the length of the cables and the cross-sectional area.
Note. The composer does not perform yield calculations.
To start the Photovoltaic plant composition utility, you need to select a distribution utility to which to connect the plant and use the command in the Tools bar.
For more details, please refer to the Ampère manual in the chapter "Networks with photovoltaic plants".

EGlink: BIM integration between Revit© MEP and - Ampère Professional/Evolution
EGlink is an interchange plug-in between Autodesk Revit and Ampére Professional/Evolution and represents the Electro Graphics's response to BIM (Building Information Modeling) process mode. Here are the most important features and enhancements introduced in EGlink 2024.
Function extension and update to Revit 2024
EGlink 2024 is compatible with Autodesk Revit 2018 to 2024 version.
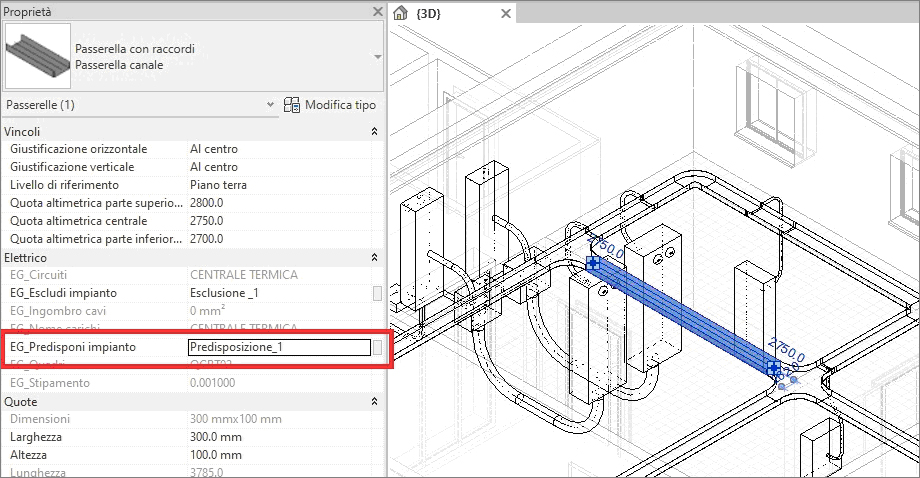
New cable routing rulesi
The routing function in EGlink evaluates the routing of electrical circuits through the network of protective pipes and walkways that connect the various electrical equipment and devices. For documentation, see "Routing" in the EGlink reference guide.
A new parameter has been developed to provide greater control and precision during the design and threading of cables in a specific duct run.
The EG_Exclude plant option allows the designer to exclude a duct run from the cable design and threading process. However, in some cases, it is necessary to force the passage of the circuit and, consequently, the threading of the cables for a given duct run. To meet this need, we have introduced the new EG_Prepare plant parameter.
EG_Prepare plant is essentially the opposite of the EG_Exclude plant parameter. When you fill in the EG_Prepare plant parameter for a specific duct run, you are essentially telling the software to consider the passage of the circuit in that duct run as mandatory. This means that the software will automatically calculate and thread the cables to ensure the correct and complete connection in the plant.
This new functionality is particularly useful when you want to ensure the presence of a circuit in a specific duct run, as in the case of regulatory requirements or when you want to maintain a continuous connection between two points.
Consider an example in which you want to install a new circuit to power a new electrical equipment. The circuit must pass through an existing duct run that hosts other circuits. If you use the EG_Exclude plant parameter for the duct run, the software will exclude that duct run from the cable design and threading process. This means that the circuit will not be able to pass through the duct run and the new equipment will not be able to be powered.
If you use the EG_Prepare plant parameter for the duct run instead, the software will consider the passage of the circuit in that duct run as mandatory. The software will automatically calculate and thread the cables to ensure the correct and complete connection in the plant.
The new EG_Prepare plant functionality offers greater control and precision during the design and threading of cables in a specific duct run. This new functionality is particularly useful when you want to ensure the presence of a circuit in a specific duct run, as in the case of regulatory requirements or when you want to maintain a continuous connection between two points.
See all new features 2024:
Download brochure Electro Graphics New features 2024